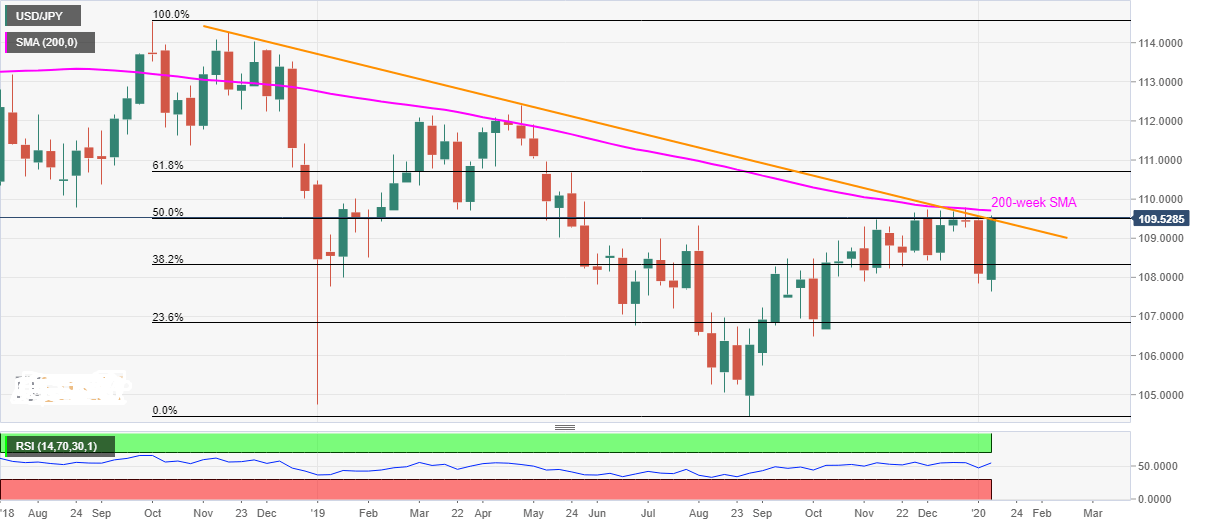
USD/JPY Technical Analysis: Weekly close beyond 109.70/75 will be a call to bulls

By Ritu,
- USD/JPY trades positive near the two-week high, on a five-day winning streak.
- Bullish engulfing on the weekly chart confronts 109.48/52 resistance confluence.
- 200-week SMA adds to the resistance.
USD/JPY takes the bids to 109.55 during the initial trading session on Friday. In doing so, the pair registers a bullish candlestick formation on the weekly chart that currently confronts the key resistance confluence.
In addition to 109.48/52 area including 50% Fibonacci retracement of October 2018 top to August 2019 low and a downward sloping trend line since November 2018, 200-week SMA around 109.70/75 also challenges the buyers.
If at all USD/JPY prices register a weekly closing beyond 109.75, it confirms the bullish engulfing candlestick pattern on the chart while also the bulls to aim for the late-May top near 110.00.
Following that, 61.8% Fibonacci retracement level of 110.70 and April 2019 high of 112.40 will lure the buyers.
On the downside, pair’s declines below 108.45/40 hold the key to 108.00 and 107.50 support levels. However, the pair’s drop beneath 107.50 might not refrain from dragging the quote to the sub-107.00 region.


